
I recently got into a debate with a fellow rider about what numbers on the Peloton dashboard to watch for. No matter my workout, from yoga to weights to running to cycling, I always try to reach a certain caloric number. I even stack my workouts to reach that target. And it helps me understand the intensity versus time of my workouts.
Some are short burners, and some workouts need a quick cardio burst to meet my targets. She, however, looks at the strive score, coded in green. That had me scratching my head. I’ve had hard workouts give me a 7, and then one long easy cardio gives me an 80. What gives? She swears by striving.
I was given the opportunity to chat with Matty Maggiacomo (a.k.a. Mara Thonner) on a recent trip to Toronto. So, I had to ask about how my dashboard can help me do better in my Peloton workouts.
Peloton Bike Bootcamp review: It’s devastatingly hard, but in a good way.
What’s on the Peloton dashboard?
The answer really depends on the device you’re using. For example, Peloton Guide looks different from what you will see when using the Peloton Bike/Bike+, Tread, app (which is available on phones, tablets, and smart TVs), or even the free version of the app. But for the sake of not turning this quick reference guide into a full-on owner’s manual, I’ll cover the basics.
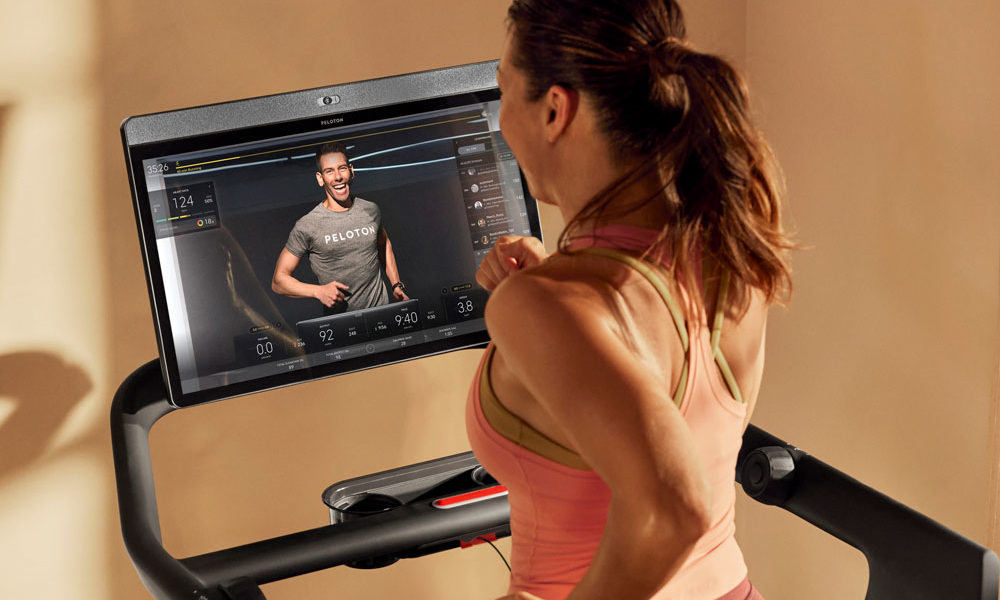
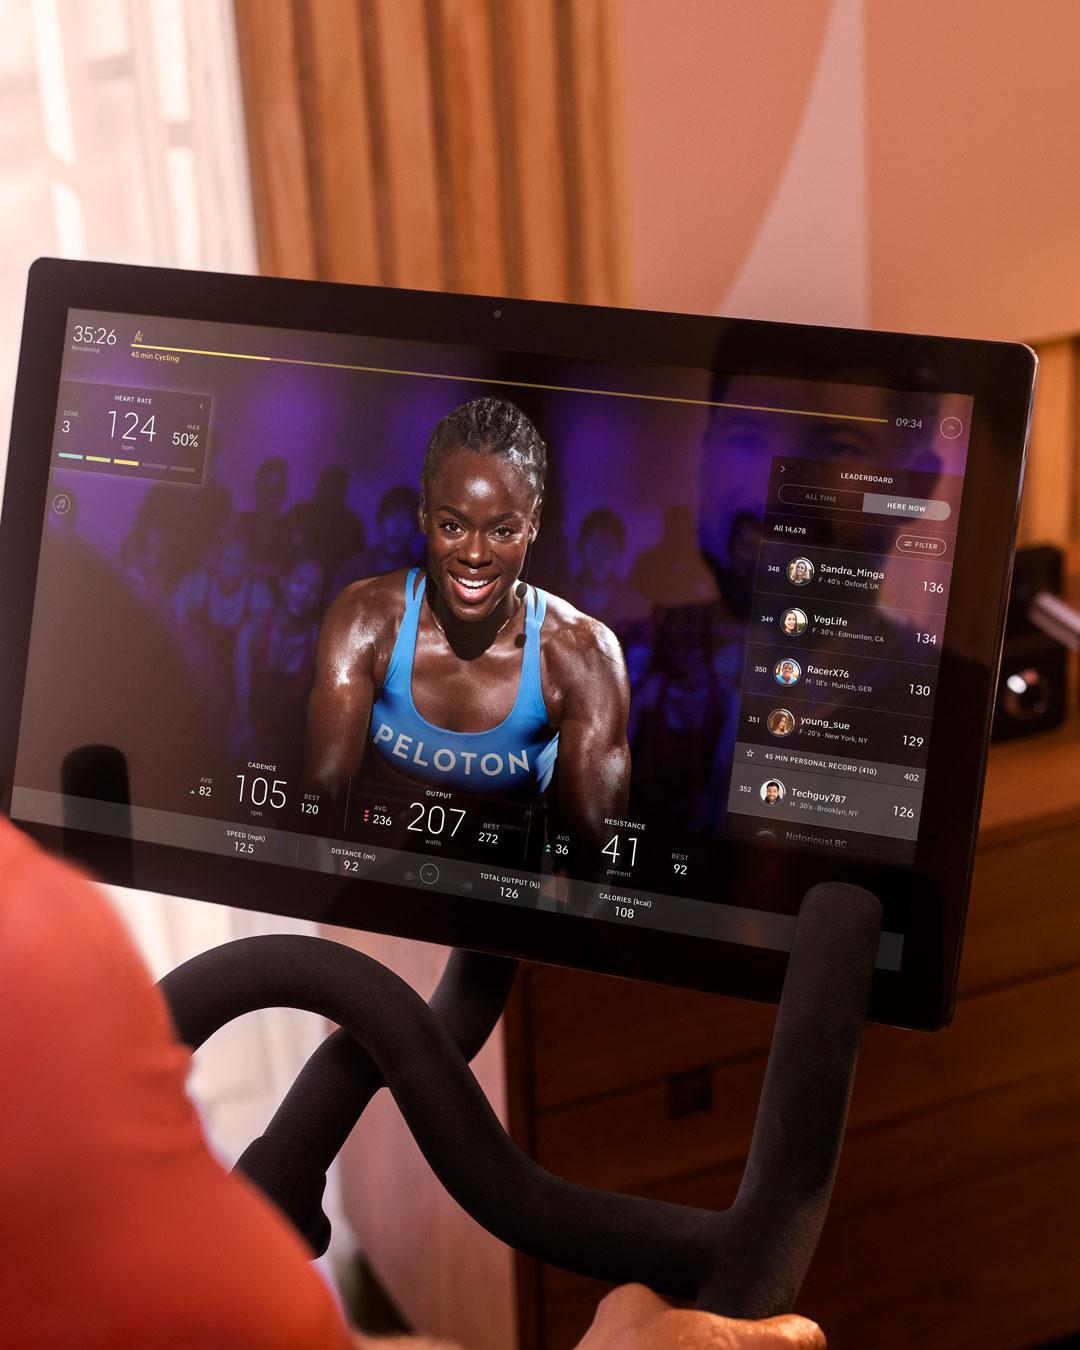 The dashboard of the Peloton bikes (including Bike+) shares a bunch of data, including cadence and resistance

Bike dashboard data points
Here‘s what you will see on your Peloton Bike or Bike+ dashboard.
- Heart rate monitor (HRM), including which intensity zone you are in (there are five), current heart rate, and a percentage of your maximum heart rate capacity
- Strive score (how intense your workout is based on your output and heart rate)
- Music
- High fives
- Cadence (how fast you’re spinning your wheels), including average cadence for the workout, current cadence, and best cadence of the workout
- Speed in miles per hour
- Distance in miles
- Output (how much power you have used in watts), including average output for the workout, current output, the best output of the workout, and total output
- Resistance (how difficult it is to pedal), including average resistance for the workout, current resistance, and best resistance of the workout
- Calories burned so far
- Leaderboard shows who else is in the class, but you can filter it to include all time, current, and even based on other stats, like people you follow
- Workout progress shows how far you are into the workout you are, including time since start and time left, as well as sections like warmup, arms, weights (if you’re doing a weight or bike boot camp workout), cool down, and so on.
Peloton Tread review: Is it worth the money?
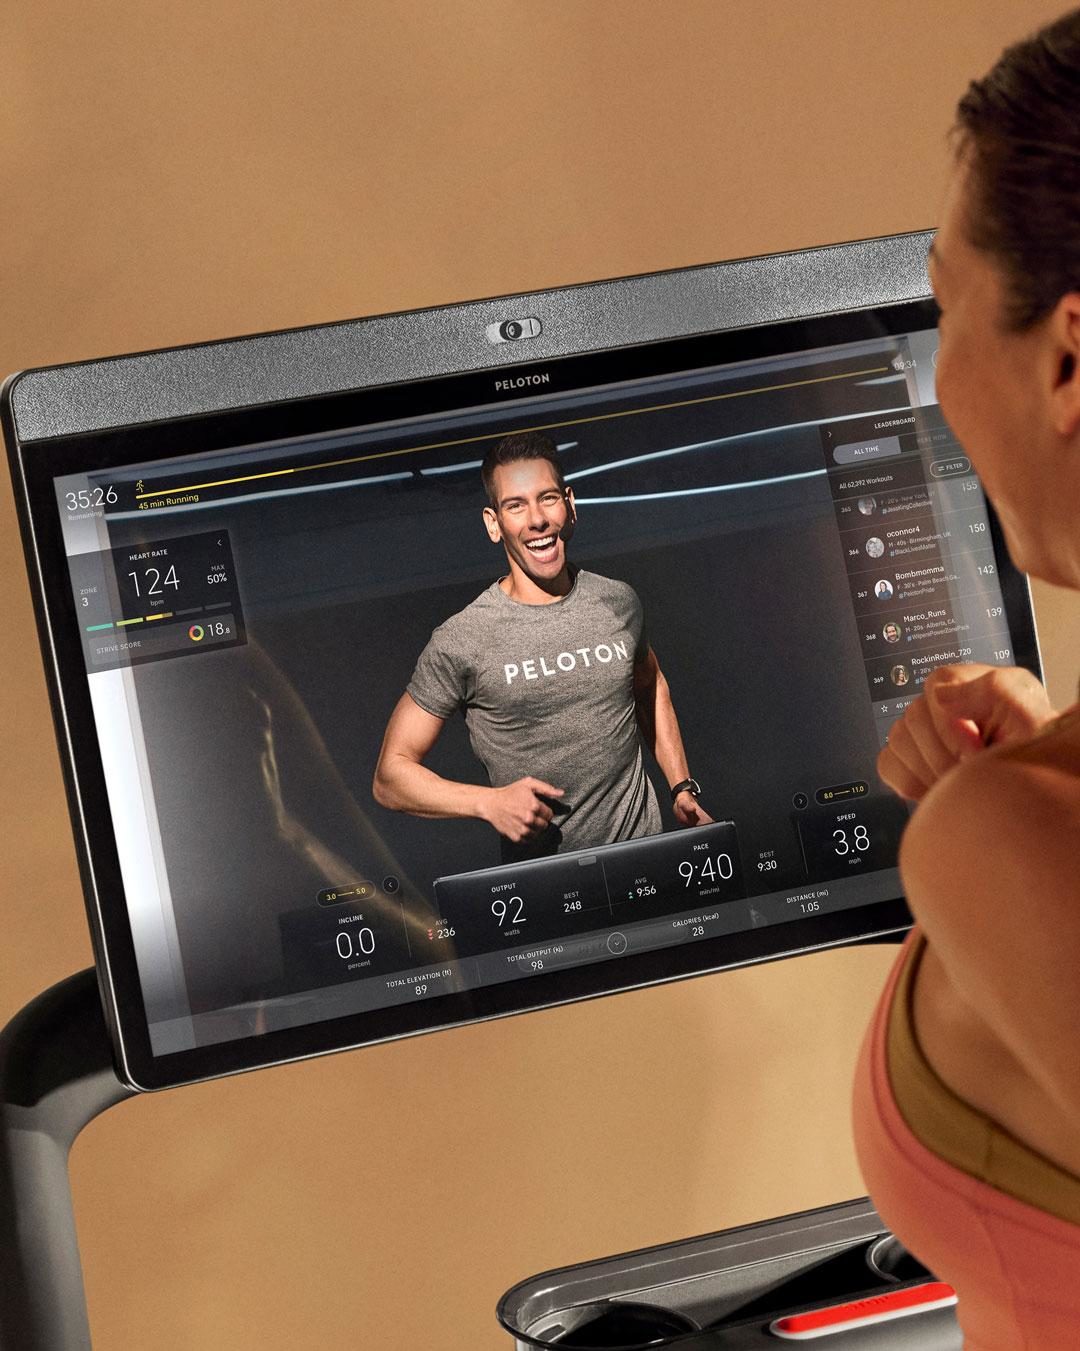
Tread dashboard data points
Here‘s what you will see on your Peloton Tread dashboard.
- Heart rate monitor (HRM), including which intensity zone you are in (there are five), current heart rate, and a percentage of your maximum heart rate capacity
- Strive score (how intense your workout is based on your output and heart rate)
- Music
- High fives
- Incline (how steep your treadmill is set) as well as average and total incline for the workout
- Output (how much power you have used in watts), including average output for the workout, current output, the best output of the workout, and a total output
- Pace (how quickly your feet are hitting the belt of the treadmill), including average pace for the workout, current pace, and best pace of the workout
- Speed in miles per hour
- Calories burned so far
- Distance in miles
- Leaderboard shows who else is in the class, but you can filter it to include all time, current, and even based on other stats, like people you follow
- Workout progress shows how far you are into the run you are, including time since start and time left, as well as sections like warmup, weights (if you’re doing a treadmill bootcamp), cool down, and so on.
Peloton yoga review: It’s got every type of class under the sun (salutation).
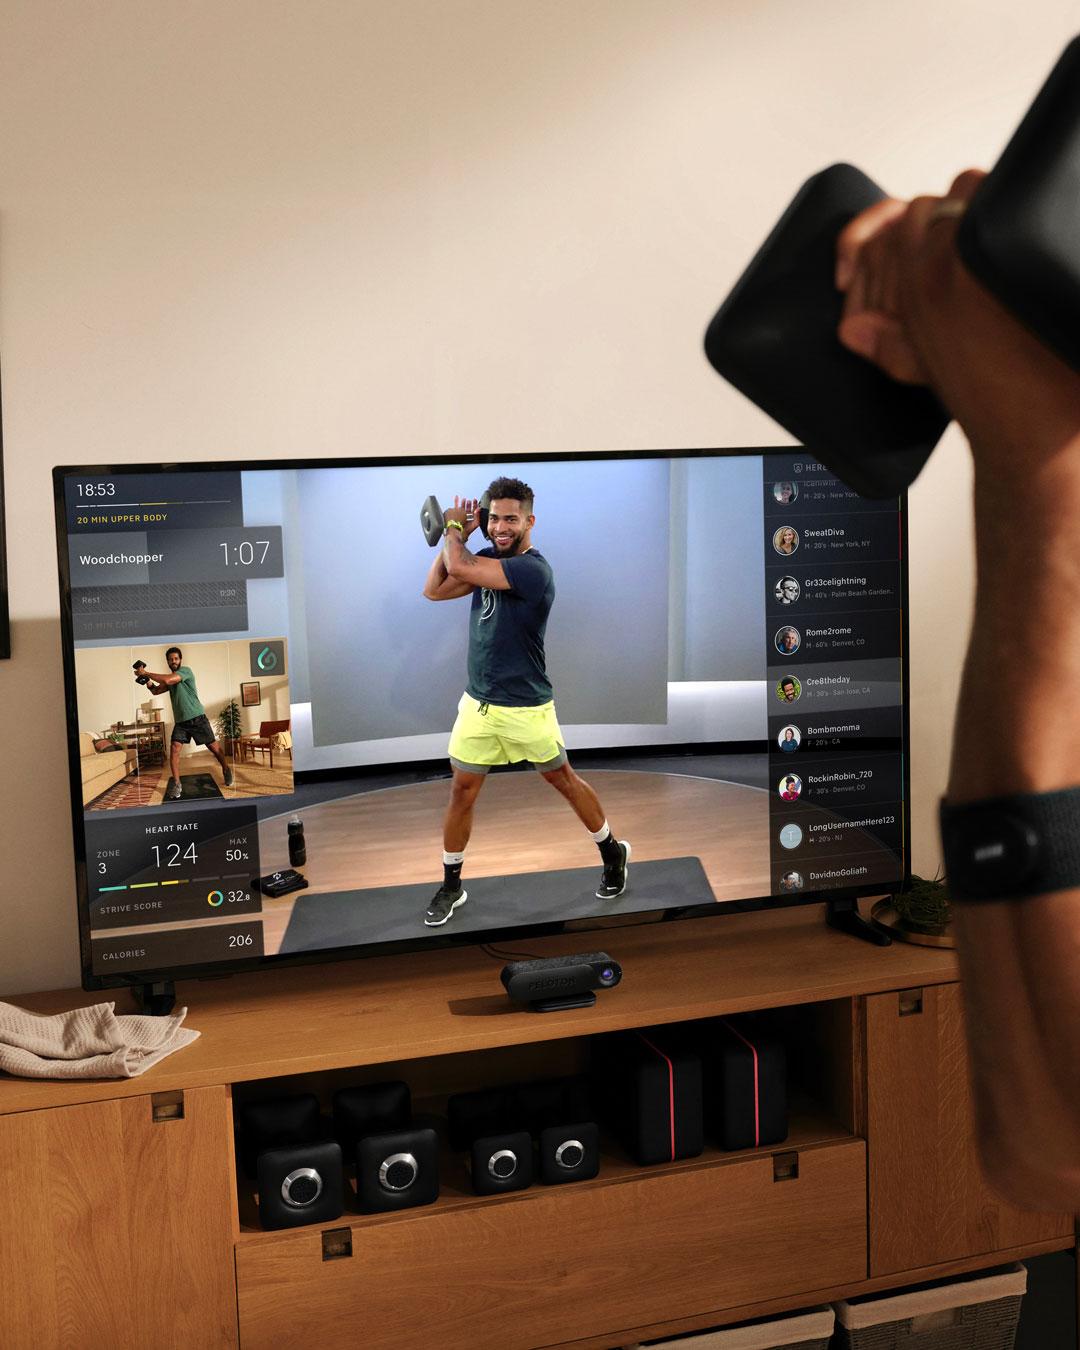
Guide/app dashboard data points
Here‘s what you will see on your Peloton Guide and app dashboards.
- Workout progress shows how far you are into the workout you are, including time since start and time left, as well as sections like warmup, cool down, and so on
- Exercise that you’re doing right now, the time left in the set, and the next set or rest period
- Heart rate monitor (HRM), including which intensity zone you are in (there are five), current heart rate and a percentage of your maximum heart rate capacity
- Strive score (how intense your workout is based on your output and heart rate)
- Calories burned so far
- High fives
- Cadence (how fast you’re spinning your wheels), including average cadence for the workout, current cadence, and best cadence of the workout
- Speed in miles per hour
- Distance in miles
- Output (how much power you have used in watts), including average output for the workout, current output, the best output of the workout, and total output
- Resistance (how difficult it is to pedal), including average resistance for the workout, current resistance, and best resistance of the workout
- Leaderboard shows who else is in the class, but you can filter it to include all time, current, and even based on other stats, like people you follow
- Sweat points (tracking your movements and reps in each set)
What Is The Peloton Guide? Should Canadians Add To Cart?
Rowing machine dashboard data points
Here‘s what you will see on your Peloton Row dashboard. (The actual machine will available in Canada late 2023. You can read more on the Peloton site. In the meantime, rowing workouts can be found on the app.)
- Form assist to show you the position and proper form for the current movement
- Heart rate monitor (HRM), including which intensity zone you are in (there are five), current heart rate and a percentage of your maximum heart rate capacity
- Strive score (how intense your workout is based on your output and heart rate)
- Music
- High fives
- Distance in miles
- Strokes completed so far
- Pace (how quickly your strokes are), including average pace for the workout, current pace and maximum pace of the workout
- Output (how much power you have used in watts), including average output for the workout, current output, best output of the workout and total output
- Stroke rate (how many strokes per minute), including average stroke rate, current stroke rate and maximum stroke rate of the workout
- Calories burned so far
- Leaderboard showing who else is in the class, but you can filter it to include all time, current, and even based on other stats, like people you follow
- Workout progress shows how far you are into the run you are, including time since start and time left, as well as sections like warmup, weights (if you’re doing a treadmill bootcamp), cool down and so on.
Lagreeing At Home review: one of the few virtual workouts that won’t let you cheat.
Peloton app dashboard data points
Here‘s what you will see on your Peloton app dashboard, depending on the workouts you do, from gym to outdoor runs.
- Workout progress shows how far you are into the workout you are, including time since start and time left, as well as sections like warmup, cool down and so on
- Heart rate monitor (HRM), including which intensity zone you are in (there are five), current heart rate and a percentage of your maximum heart rate capacity, if you connect your HRM to the app
- Strive score (how intense your workout is based on your output and heart rate)
- Calories burned so far
- High fives
- Distance in miles
- Output (how much power you have used in watts), including average output for the workout, current output, best output of the workout and total output
- Leaderboard showing who else is in the class, but you can filter it to include all time, current, and even based on other stats, like people you follow
“The beautiful thing about these machines is that it tracks and helps you visualize [performance],” says Maggiacomo. “The old-school way: We would carry around a notebook. It was the ‘Fred Flintstone’ way of monitoring your quote unquote stats. But now you’re sitting on all of this information.”
Kardia Athletica review: The on-the-go workout that blends the best of YouTube and online gyms.
Why is my output so low sometimes? Why is it so high sometimes?
Ever notice your outputs going all over the place from one workout to the next? Maggiacomo tells me that’s “because it’s all about energy levels, energy reserves and supply.” Whether you’re using the Guide, Tread or Bike, this stat tracks how hard you’re going. But instead of looking to always have that number high Maggiacomo says to use it smarter.
“When I started on my racing journey, I always thought, OK, go out real hard. You’ll get a leg up on everybody and some distance. And that’s, really, the wrong way to run. It took me a really long time to realize that this is not the way that you’re supposed to run a race, whether it be a 5K or a marathon.” Instead use output to manage your energy (not exhausting yourself too early), recognizing that you want to grow that number over time, not in a single workout. “And you’ll see the output change,” he says.
So, what exactly is output? It’s your power measured in watts, meaning much power you’re exerting during the workout. Members can increase their output by increasing their cadence, their resistance, or both on the Peloton Bike or Bike+ or by increasing their incline, their speed, or both on the Tread, according to the Peloton site. Total output measures the entire workout.
Advance your Peloton workout: Understand that your body evolves as you get fitter and stronger. So use that as a guide, so to speak. Match it with how you feel, and be aware to not exhaust yourself too soon in your workouts.
Peloton Guide Canada Review: With AI Eyes On My Form, Are My Workouts Better?
What does “strive score” mean?
The strive score is a non-competitive metric based on your heart rate, measured with a compatible heart rate monitor, such as Peloton’s Heart Rate Band. It’s personal to you and every other member. Strive score measures the time you spend in each heart rate zone. It tracks how hard you’re working in every workout – from equipment to the floor.
I’ll do a heavy lifting sesh, and my strive score is low. Then I’ll do a relatively easy ride and it’s higher. And one time during a snowstorm, I strapped on my Heart Rate Band and connected it to my phone to “track activity,” as I shoveled a record snowstorm and it was the highest ever!
Generally, I have a low heart rate and I do have a hard time with endurance workouts. “With the fittest people, their heart rate is slower, which is kind of amazing when it comes to cardiac capacity,” Maggiacomo tells me, adding that the more fit you become, you might not see drastic changes in your strive score as your heart becomes more efficient.
Look at the I know what you’re thinking: Are the Peloton HR Zones similar to the fat burn zones on other HRMs, including the Apple Watch? That’s kind of how I was thinking of it.
Yes, and no. The five different zones are based on the level of effort based on the percentage of your maximum heart rate (MHR).
What the Peloton zones mean
| ZONE | TYPES OF EXERCISE | MHR | WHAT THAT SHOULD FEEL LIKE |
|---|---|---|---|
| Zone 1 | Warm Up | Up to 65% | Easy effort, like a warm up, recovery or cool down |
| Zone 2 | Endurance | 65% to 75% | Average effort, like a comfortable, sustainable challenge |
| Zone 3 | Power | 75% to 85% | Above average effort, which feels challenging with heavy breathing |
| Zone 4 | Threshold (multi-minute sprints) | 85% to 95% | A hard effort that’s very challenging |
| Zone 5 | Maximum capacity (very short bursts) | 95%+ | The hardest one can go, pushing to reach the finish line |
The goal is to give you an easy way to compare your performance. It works across workouts, including those that don’t have power-based output from a connected device, like strength, HIIT (high-intensity interval training) and boot camp classes.
Advance your Peloton workouts: Feeling like your strive score has plateaued or is getting lower? It may be time to recalibrate your data, including maximum heart rate. Take a Power Zone Training class to calculate your FTP (Functional Threshold Power) class. FTP is the highest power a rider can maintain for one hour on the bike. It is based on the average output over a 20-minute maximum effort test, which can be found by filtering for Power Zone classes. Each is 20 minutes in length, and Peloton recommends retesting every four to six weeks. As you continue with Power Zone Training, you’ll probably notice that higher outputs feel easier to achieve. Your new FTP score automatically adjusts your personal power zone ranges in your workouts so that you can keep challenging yourself.
It will ensure your dashboard is accurate.
Peloton Boxing Review: It Didn’t Knock Me Out, But It Was The Kick In The Butt I Needed.
Where should I fit within the leaderboard?
Peloton became mass, thanks to the pandemic when most of us were forced to work out at home and hang up our locker locks. So I did notice that where I fit in the leaderboard shifted pre, during, and post-lockdowns. But I’ve always told myself, “I’m not an athlete – I’m doing this for fun and to keep fit.” As long as I was around the middle, I’m doing OK.
Was I right? According to Maggiacomo, I was half right.
“You’re going to fall into one of two buckets.” The competitive Peloton members “want to be on the top of the leaderboard” and those who don’t simply swipe the leaderboard away from the dashboard. But as we talk, Maggiacomo tells me about a third group: The tortoises. “They just use it for the community and social aspect where they’re high-fiving. You’ll recognize them with the turtle emoji ? in their names and bios. “They’re at the bottom of the leaderboard.
How to be motivated by the leaderboard
He says to use the leaderboard to motivate you and your goals – and ultimately do what makes you feel good. “Nobody should ever beat themselves up because they’re in the lower third of the leaderboard, and if you’re at the top of the leaderboard, amazing.
“We also get to see the milestones. Consistency is key. So, when people are celebrating being in the ‘comma club’ for their 1,000th, 1,500th, and 2,000 workouts, people want to be seen.”
So, you can use the leaderboard like a who’s-here list. “It’s really to find ‘your people.’ ”
Advance your workout: If you thrive off of competition for motivation then the leaderboard is a good place for you. But instead of competing against everyone, narrow down the leaderboard to who you really want to compete with by using the filters, whether that’s by age, gender, friends or hashtag. Heck, if you want to just compete with yourself, look at your personal record output (just above your name in the leaderboard).
Peloton barre review: It’s not your typical barre class by any stretch or plié.
What does a Peloton instructor see on their dashboard?
Do they see everyone? Are they prompted to say, Happy Birthday?
“I can filter,” Maggiacomo tells me. “I can see everybody, and I can see whatever information you want me to see – all the birthdays and milestones, where you’re from your tags. Of course, as I’m teaching, I have my notes. It doesn’t look that different from your screen. […] And I have a separate timer. It’s a lot of fun from where we stand.”
What does Maggiacomo look for on his dashboard? “Honestly, I really don’t look at it a whole lot. I do like to make sure that I’m sprinting and hitting double digits – that’s for sure. It’s a feeling for me. To go back to that rate of perceived exertion, which is very individual and similar to the strive score. Based on a scale of one to 10 – how hard you work – if I can get up to eight or nine, I’m like, wow. That was 20 minutes, and I really pushed myself.”
Try streaming these at-home rebounding workout videos.
Advancing your workouts beyond the Peloton dashboard
In addition to working out consistently, there are other things you can do to get fitter.
Make sure you’re taking the right level of workout
Beginner is exactly what you think it is. A member’s introduction to whatever class they’re taking. For example, Beginner runs are intended to be members’ first intro to the Tread, the instructors, metrics, paces, drills, skills, and form. The focus is on finding paces and feeling. Run segments are never longer than 90 seconds and are offered in both 15- and 20-minute durations.
Intermediate workouts are for those who are more comfortable with their way around the workouts. They don’t need a lot of instruction but enjoy their rest between intervals.
For runs, unleveled runs are created for those of all skill and fitness levels, which is why they make up the majority of the running class library. While the Instructors cues to intermediate speed ranges, members are always encouraged to work at whatever pace feels right for them.
Advanced workouts are the highest difficulty level. The workouts can seem more challenging and complex, with shorter rests. And advanced runs are designed for seasoned members looking to up their game and where instructors coach to faster speeds and more challenging efforts.
Level up with a program or start a collection
First, what’s the difference between a program and a collection? The Peloton blog puts it like this: “Peloton programs are a collection of classes, designed by an instructor to help reach a specific goal and track your progress.” Whereas the collections are classes grouped together that fit a certain fitness or music theme, without the prescribed scheduling and progress tracking of programs.
You can find programs in the app, on the Peloton Bike and Bike+, for the Tread and Guide. Program features include training progression-dedicated classes, recommended schedules, and progress reports and trackers. Don’t know where to start? Try Crush Your Core, Beginner Strength, Road To Your 5K and You Can Run Outdoors.
Collections are just as easily available. Try Yoga for Cross Training, Made for Travel, Peloton Boxing, The Mariah Carey Collection, Strength for Runners, Pride, and Made for Canada. Have a favourite singer or band? Search for them, and you may find a collection of classes you can stack or plan out for the week.
What do your personal bests mean?
Personal bests are, well, personal, Maggiacomo tells me. “Personal best is 100% always up to you. Everybody has their own specific journey, and it depends on why you’re getting on your bike or on your treadmill. There have been periods of my fitness journey where I have gone through where I am reaching a new personal best every day and then where I haven’t reached anything new. It’s up to you to truly set that goal. You can break it down, like every month to get 1% better. Just go for it. But, there’s really no science behind that. We always want to obviously push ourselves to continue to change things. We want to push ourselves to continue to learn.
The Peloton dashboard: It can serve you well if you want it to
When it comes to the dashboard, Maggiacomo tells me to enjoy myself. The dashboard is a tool, but it’s not meant to affect how you enjoy your workouts. They’re numbers and insights – they don’t define you.